DURST ANALYTICS

VIEW ALL IMPORTANT PRODUCTION DATA
VIA THE WEB-BASED DASHBOARD
VIA THE WEB-BASED DASHBOARD

DURST ANALYTICS
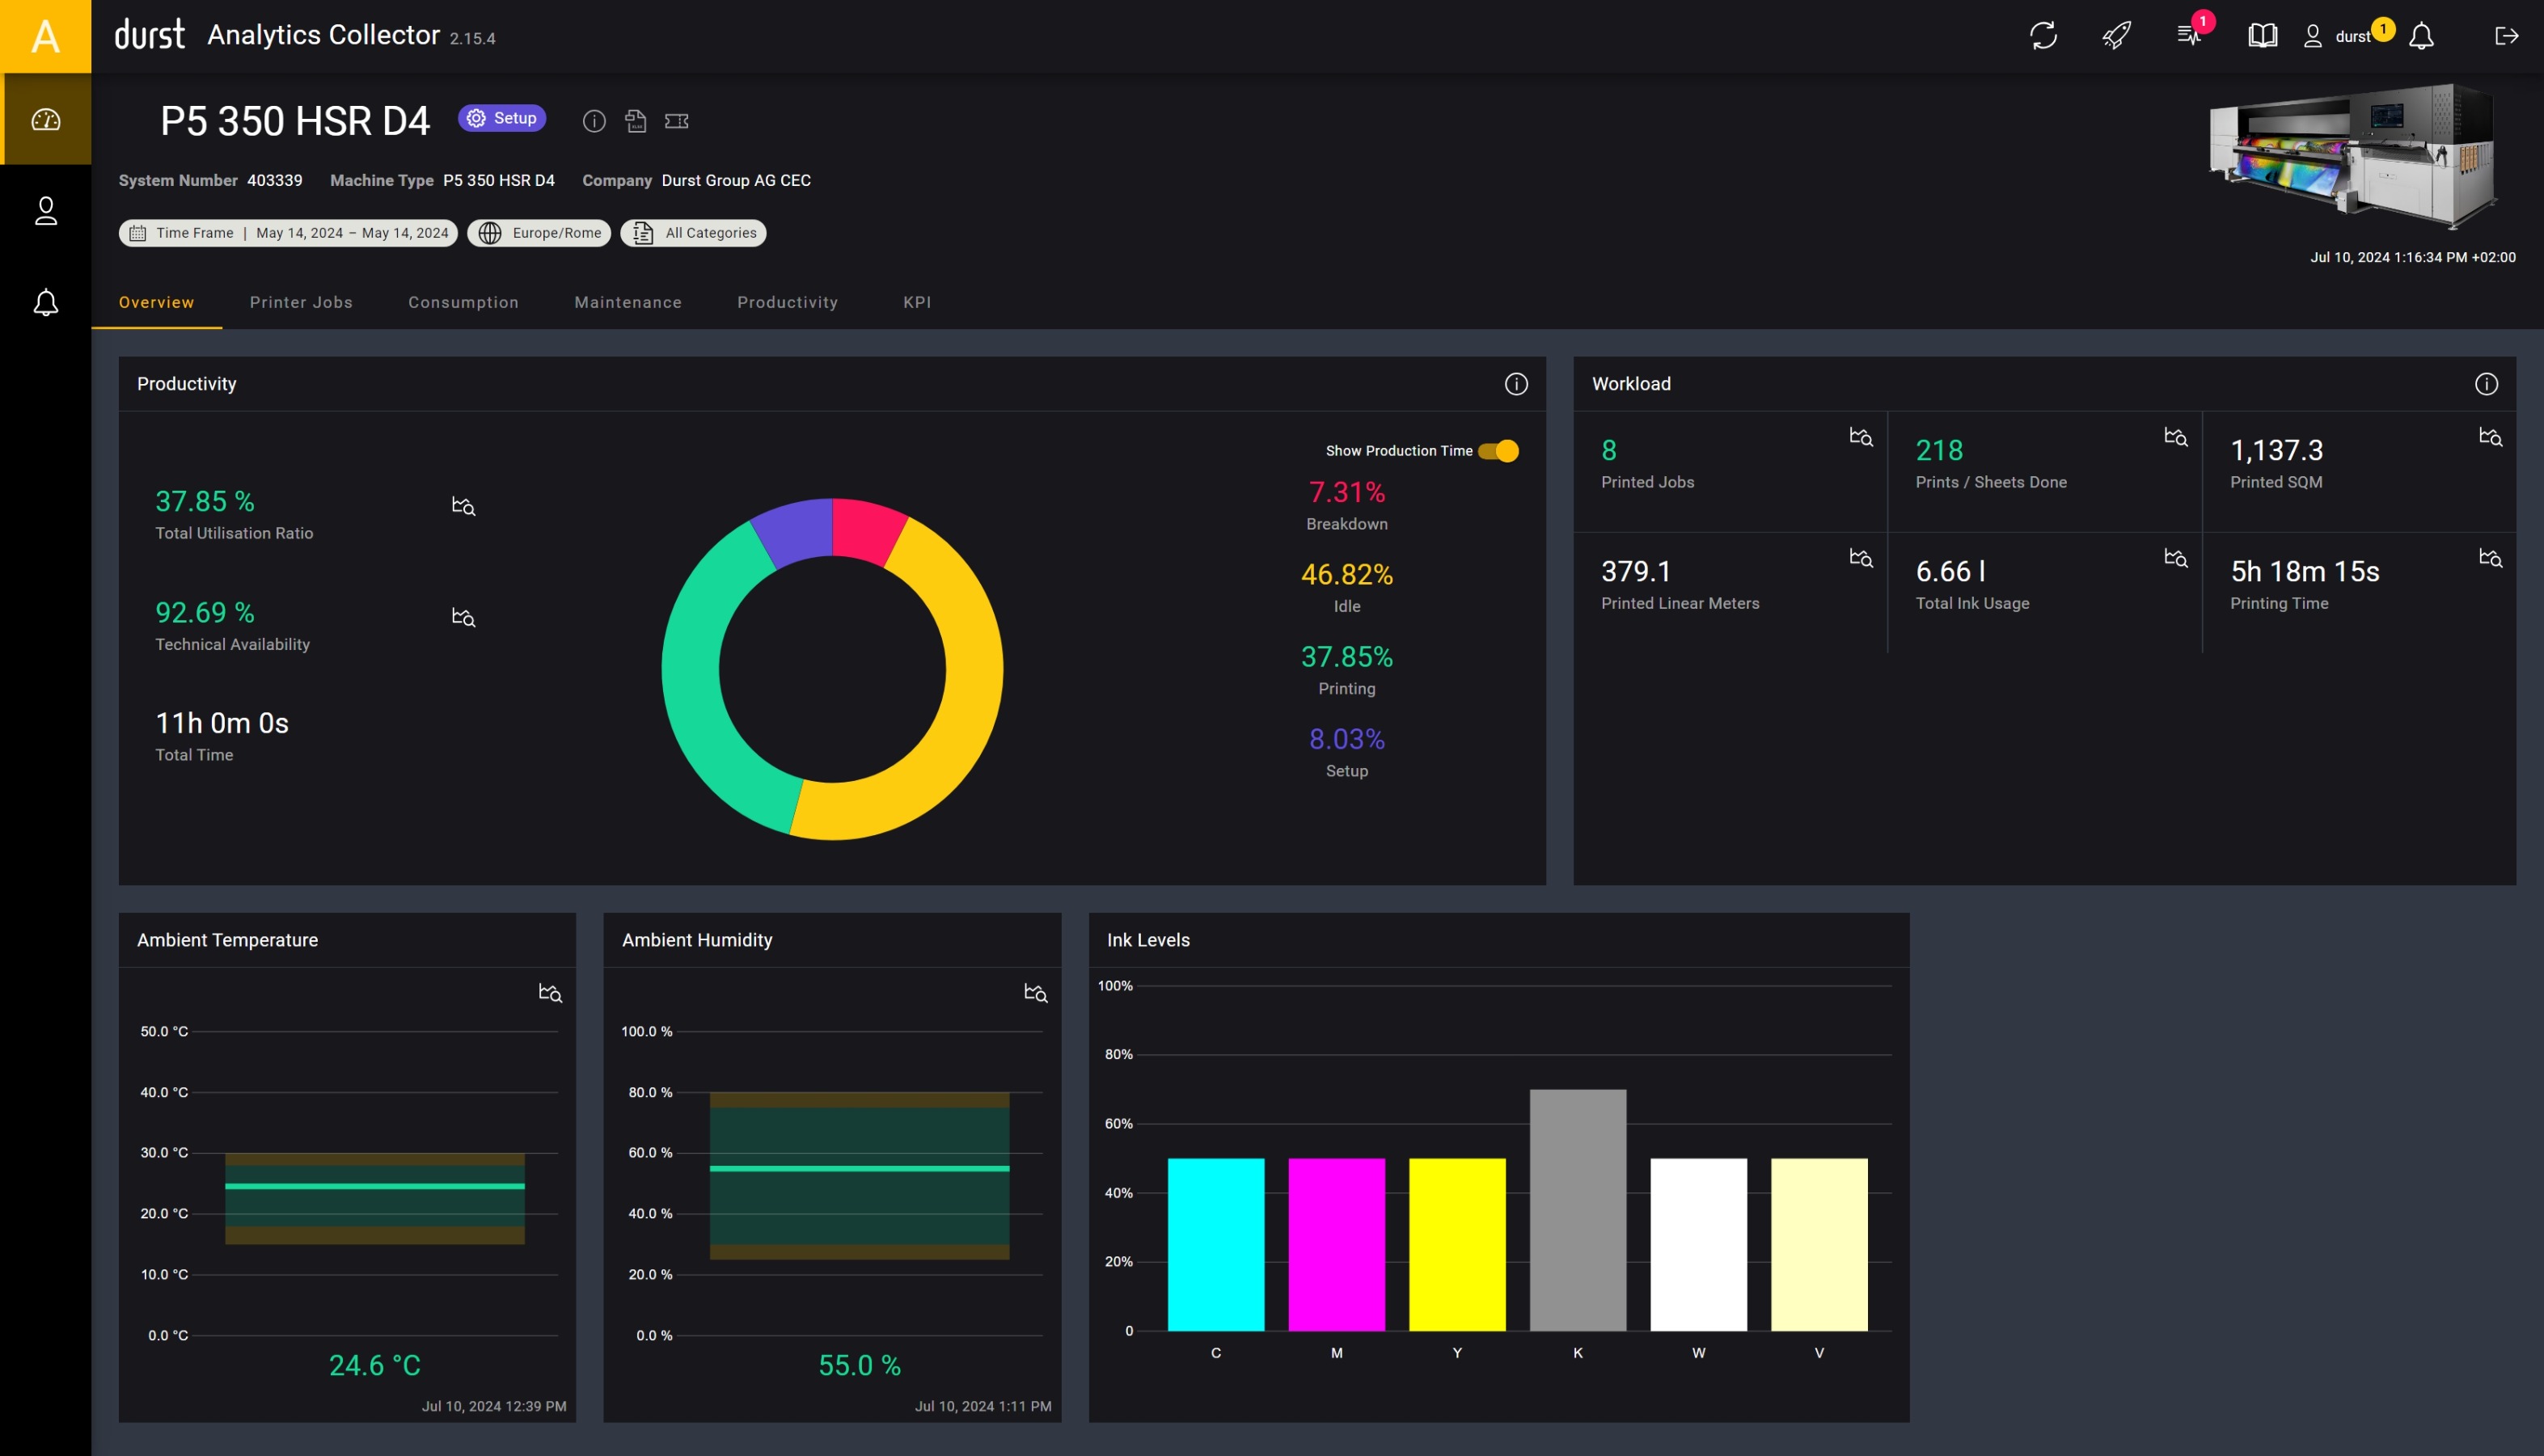
Durst Analytics provides you with web-based software that visualizes data from your Durst printers on a single screen, providing easily interpretable data for data-driven decision making.
EFFICIENCY
Use the data dashboard generated by Analytics to improve your production efficiency
REAL-TIME STATUS
Monitor your print events day by day. The printer event timeline gives you a time-based overview of the status of your machine.
DATA GENERATION
No matter how you process your print production data, Analytics makes it available to you
DURST ANALYTICS REQUEST
FEWER ASSUMPTIONS, MORE PRODUCTIVITY: FROM DATA TO DECISIONS
Keep an eye on your printer and monitor live, historical, productivity and comparative data at all times. Keep cost drivers such as ink and inefficient production processes under control and increase the productivity of your equipment. In addition, data from one or more printing systems can be imported into your own ERP/MIS tool for perfect integration of production data into your IT infrastructure.

DURST ANALYTICS
The analytics software designed for your Durst printer to enable data-driven decisions. Customised dashboards with key performance information, production schedules, detailed job information and KPI reports. Even check the condition of spare parts effortlessly to enable preventive maintenance. Increase productivity and keep your assets under control with Durst Analytics.
Would you like to receive more detailed information about the Durst Analytics? Then visit our Virtual Showroom:


